
Why you always lose to market manipulators and what to do about it
*https://www.youtube.com/watch?v=-jF9gW2r_bk
**https://300.ya.ru/v_3I5sj2Qb
таймкоды
00:00:00 Введение в симулятор рынка
- Симулятор рынка используется для анализа манипуляций на финансовых рынках.
- Манипуляции основаны на торговых моделях, которые кажутся законными.
- Пример манипуляции: «дело Фореста» в 2013 году, когда трейдеры выкачивали сотни миллионов долларов.
00:00:54 Главный герой и его стратегия
- Главный герой торгует акциями ракетной компании, делая случайные прогнозы.
- Некоторые трейдеры постоянно выигрывают, несмотря на случайность рынка.
- Возникает вопрос: как им это удаётся?
00:01:32 Проблема прогнозирования на рынке
- На рынке, управляемом случайностью, нет надёжного способа предсказать будущее.
- «Плохие актёры» идеально вписываются в хаотичный рынок.
00:01:57 Метод разоблачения манипуляций
- Предлагается способ измерить и разоблачить манипуляции.
- Видео спонсируется компанией Brilliant, автор не является финансовым консультантом.
00:02:25 Принцип работы симуляции
- Обычные люди приходят на рынок, размещая случайные заказы.
- Заказы на покупку и продажу исходят из распределения вероятностей.
- Случайность в симуляции отражает честный рынок с равными шансами.
00:03:22 Аукционное ценообразование
- Единая рыночная цена устанавливается для максимальной удовлетворённости заказов.
- Ценовой диапазон определяет дневной объём торгов.
- Метод аукционного ценообразования часто используется в начале торгового дня.
00:05:10 Полное моделирование рынка
- Настройка распределения цен по заказам.
- Рынок определяет цену и объём торгов на текущий день.
- Цикл моделирования повторяется, создавая хаотичное движение рынка.
00:06:26 Влияние внешних событий
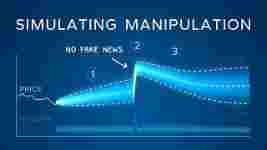
- Внешние события, такие как экстренные новости, меняют ожидания трейдеров.
- Трейдеры мгновенно корректируют свои ожидания в соответствии с новым уровнем цен.
- Цены на акции зависят от текущих и будущих новостей.
00:07:32 Непредсказуемость трейдеров
- Трейдеры игнорируют новости и слухи о будущем, что делает их непредсказуемыми.
- Манипулирование с помощью ложной информации невозможно.
00:08:27 Закономерности в моделировании
- Моделирование в течение 500 дней показывает закономерности, которые выглядят как порядок.
- Распознавание закономерностей помогает понять структуру рынка.
00:09:01 Гипотетические рынки
- Первый рынок: трейдеры с неограниченным богатством, цены следуют гауссовскому случайному блужданию.
- Второй рынок: трейдеры ограничены своим богатством, объёмы покупок сокращаются при высоких ценах, продажи остаются неизменными, создавая асимметрию.
00:10:58 Асимметрия на втором рынке
- Заказы на продажу остаются неизменными, в то время как объёмы покупок сокращаются.
- Асимметрия создаёт естественное притяжение, подталкивающее цены назад.
00:11:29 Теоретический предел и динамика рынка
- При бесконечном количестве трейдеров индивидуальные действия органично вписываются в общую систему, создавая более плавные кривые и раскрывая динамику рынка.
- На втором рынке цены колеблются вокруг гравитационного центра, образуя полосу.
- Теоретически цены могут расти бесконечно, но это становится маловероятным из-за асимметрии порядка.
00:12:16 Правила торговли и трендовые каналы
- Правила торговли создают мягкие ограничения на колебания цен.
- Добавление новых денег в сделки трейдеров формирует статистически значимый трендовый канал.
- Моделирование не предписывает рынку формировать каналы, они возникают естественным образом.
00:13:09 Влияние объёма торгов на волатильность
- Увеличение объёма торгов делает цены менее волатильными.
- Небольшое количество заказов приводит к неустойчивым кривым ордеров и большим скачкам цен.
- При большом количестве заказов цены почти не колеблются.
00:14:21 Контроль над рынком
- Поведение трейдера формирует случайность на рынке.
- Победа достигается через установление контроля над рынком, а не через предсказание будущего.
- Контроль включает диктовку цен и формирование восприятия рыночных тенденций.
00:15:40 Манипуляции рыночной ценой
- Искусственное повышение рыночной цены через покупку акций.
- Самоторговля позволяет манипулировать ценой без оплаты счетов.
- Имитация увеличения объёма создаёт иллюзию ликвидности рынка.
00:18:31 Монопольная власть на фондовом рынке
- Наложение ордеров на покупку и продажу создаёт иллюзию высокой активности.
- Пересечение кривых даёт контроль над рыночной ценой.
- Монопольная власть позволяет диктовать цены и искажать сигналы.
00:20:29 Схема «накачки и сброса»
- Схема начинается с покупки акций, затем следует манипулирование ценами с помощью самоторговли.
- Цель — незаметно продать акции по завышенной цене.
- Симуляции показывают, что версия без манипуляций уступает по эффективности версии с манипуляциями.
00:22:46 Предсказуемость поведения трейдеров
- Даже на случайном рынке можно предсказать поведение трейдеров.
- Манипуляторы используют предсказуемость для получения прибыли.
- Трейдеры часто полагаются на последние ценовые тенденции.
00:23:31 Фундаментальные факторы и человеческий фактор
- Рациональный подход к сделкам требует участия всех участников рынка.
- Рынки управляются участниками, которые перекупают друг друга.
- Человеческий фактор играет ключевую роль в формировании цен.
00:24:13 Манипуляции через скоординированные заказы
- Манипуляторы распределяют скоординированные заказы по рынку.
- Эти сделки имеют достаточный вес для влияния на цену.
- Плавное распределение ордеров усложняет обнаружение манипуляций.
00:24:49 Количественное определение манипуляций
- Отклонения в форме кривой порядка помогают выявить манипуляции.
- Стандартизация кривых и симуляции без манипуляций создают ориентиры для нормального поведения рынка.
- Необычное поведение на кривых порядка указывает на манипуляции.
00:25:33 Оценка интенсивности манипуляций
- Необычному поведению присваиваются номера для оценки интенсивности манипуляций.
- Связь между распределением богатства и статистической механикой идеального газа помогает понять рынки.
00:26:22 Реакция рынка на новости
- Скачки цен могут быть вызваны реальными новостями или манипуляциями.
- Кривая настроений отражает коллективное мнение рынка о будущем компании.
- Позитивные новости могут сдвинуть кривую настроений вверх.
00:27:56 Методы маскировки манипуляций
- Манипуляторы могут замаскировать свои действия, создавая иллюзию нормального рынка.
- Тщательное распределение цен позволяет придать кривой конечного заказа нормальный вид.
- Первоначальные затраты на маскировку манипуляций могут быть огромными.
00:28:46 Манипуляции и реальная информация
- Манипуляции могут сочетаться с реальной информацией, усиливая или преуменьшая её значимость.
- Сложно определить, какой рынок свободен от манипуляций.
00:29:18 Последствия монопольной власти
- Монопольная власть над рынком делает его неэффективным для всех участников.
- Регулируемые рынки контролируются надзорными группами.
- На менее регулируемых рынках важно быть осторожным.
00:30:31 Реклама курсов Brilliant
- Brilliant предлагает интерактивные курсы по науке о данных.
- Курсы помогают определять тенденции и принимать разумные решения.
- Возможность бесплатного тестирования курсов в течение 30 дней.
In this video
FOREX Case
0:01
This… is a market simulator that we’re going to build in this video. And we’re using it to see and understand
0:08
trade-based manipulation in action. Unlike fake news, this manipulation exploits specific trading patterns
0:16
seeming legal at first glance as it involves no blatant lies. And this isn’t just a story about smaller, less-regulated markets.
0:25
The foreign exchange market, the largest financial market in the world, was traditionally believed to be too big to manipulate,
0:32
which turned out to be a costly mistake. Discovered in 2013,
0:37
a handful of traders orchestrated what became known as ‘The FOREX Case’, siphoning away hundreds of millions for years.
0:45
Thankfully, we’re not completely helpless. With some math and financial forensic tools,
0:51
we can spot the manipulators. And here is our protagonist, who wants to take a chance in the market
0:58
by trading shares of a rocket company. And, just like many of us, they all have a hard time making good predictions.
1:06
So they buy and sell randomly. And for now, our friend is lucky … winning most of the time.
1:13
Not every trader can be that lucky, though! But they still believe in the fairness of the market,
1:18
trusting that everyone has an equal chance. Then, out of nowhere, some new players show up.
1:25
And they’re not just winning sometimes; they’re consistently beating the odds.
1:30
How are they doing it? At first, it seems like these bad actors might just be
1:36
better at predicting the future. But here’s the twist: in a market driven by randomness,
1:42
there shouldn’t be a reliable way to predict the future. So… how are they pulling it off?
1:48
And even more interesting, the market still looks mostly random.
1:53
The bad actors blend in almost perfectly. So, what I want to build with you today
2:00
is a way to measure and expose this manipulation. Let’s break this down and see how this fraud works
2:07
because market manipulation isn’t just about numbers moving on a screen.
2:12
This video is sponsored by Brilliant. More at the end of the show.
2:17
Quick disclaimer: I’m not a financial advisor, and this video is for educational purposes only.
2:23
Always do your own research. The price movement we just saw, comes from a real simulation I built.
Market Simulator
2:30
And here’s how it works: Every day, people come to the market to trade shares.
2:35
Not everyone is ready to trade, though some folks are just observing the market. The others are placing orders.
2:43
Take this buyer, for example. This person wants to buy 70 shares at 53 dollars each
2:50
but wouldn’t mind a lower price that’s the maximum price this person is willing to pay.
2:56
And, as I mentioned earlier, they trade completely randomly. So, their order prices could be higher or lower yesterday’s market price.
3:05
Think of these buy orders as coming from a probability distribution. And this randomness in the simulation is a great proxy to mirror a fair market
3:15
one where everyone has an equal chance. Here, no one knows what’s going to happen, and that’s fair.
3:22
Now, the shares must come from someone namely the sellers. This person might want to sell 50 shares at 45 dollars each,
3:31
but wouldn’t mind a higher price that’s the minimum price at which this person is willing to sell.
3:37
And these sell orders also come from their own probability distribution.
3:42
Now, let’s set a single market price for the day. Some people are very satisfied with this price,
3:49
while others may skip trading altogether. So, how is the price actually set?
3:54
One way is to maximize total satisfaction; the extent to which orders are over-fulfilled.
4:01
To calculate it: all the buy and sell orders are lined up. And the ideal price,
4:06
the one that brings the most satisfaction, lies somewhere in this overlap. Here, it’s not a unique price.
4:13
Any price within this range achieves the same maximum satisfaction. But picking the middle ground is a practical choice.
4:21
And this price range also determines the day’s trading volume; the number of shares that change hands.
4:27
So, if we set a different single price, one side would be more willing to trade while the other would be less willing;
4:34
reducing overall agreement. As a result, fewer shares are traded,
4:39
since both sides must be satisfied for a deal to happen. This method is called auction pricing.
4:46
In real-world markets, it’s often used at the start of the trading day to match all the overnight orders to a single, opening price.
4:54
During a continuous trading day, orders are often instantly matched against each other leading to multiple prices in the short time frame.
5:02
But that’s a story for another time. Here, I assume a single trading moment at each day
5:08
using auction pricing. And this is what the full market simulation looks like.
5:14
We start with setting up the order price distributions. In reality, buyers and sellers might have different expectations,
5:22
leading to different distributions. But for today’s video, I don’t really need this degree of freedom,
5:28
so I’ll use the same bell curve for both, centered around yesterday’s market price.
5:33
This represents the idea that people expect their orders to be filled within a familiar price range.
5:39
After all, it worked yesterday, so they hope it will work again today. From these order curves, the market determines the
5:46
current day’s price and trading volume, which we track over time in a graph.
5:52
And with that, the simulation loop is complete. Today’s market price becomes the starting point for tomorrow’s price distribution
5:59
and the cycle continues. New order curves generate new prices and volumes, and the market evolves step by step.
6:07
As a result, the market moves randomly, making it impossible to predict in a useful way.
6:13
Since each day’s price distribution is centered around the previous day’s market price, there’s no way to know if prices will rise or fall.
6:21
Now that we have the simulation running, let’s see what it tells us. One obvious fact is that markets don’t operate in isolation.
6:30
External events like breaking news are constantly reshaping expectations. So, these distributions shift as people’s expectations evolve.
6:40
For example, when good news arrives, a company’s true value may be higher than
6:45
what’s reflected in its current stock price. And as more and more traders become aware of the news,
6:51
they anticipate that competition will eventually drive prices higher. To simplify our simulation, these random traders skip
6:59
the waiting game and instantly adjust their expectations to the new price level. And just like that, the market price adjusts almost immediately.
7:08
And as rational beings, we tend to think ahead. If we believe a company will continue delivering good news,
7:15
we might anticipate future price jumps. And to benefit from these future price jumps,
7:21
buyers must act quickly, before others bid the price up further, or they risk missing out.
7:26
This again creates competition, driving prices even higher almost instantly.
7:32
In other words, it’s not just today’s news that drives stock prices, but expectations about all future news also get baked into the price immediately.
7:42
But here comes the next twist: to make this market really hard to manipulate, we feed no additional information to the traders.
7:50
They ignore all news and rumors about the future. So, really, no one can manipulate
7:56
these traders with faulty information. They’re as unpredictable as it gets.
8:02
Ok, so far, we’ve created a fair market where randomness rules. Buyers and sellers act unpredictably,
8:09
and prices reflect their combined random expectations. But what if there are there invisible forces subtly
8:15
influencing the direction of these random movements? And could this cause certain price levels to be avoided,
8:21
creating soft barriers in the market? Well, let’s see what the simulation says.
Random Dynamics
8:27
Imagine running simulations for 500 days. It’s surprisingly easy to spot patterns
8:34
that look like order. But of course: in this scenario, it’s all random. Yet, not all patterns are meaningless.
8:41
And recognizing these patterns helps us understand how markets function and where limits emerge naturally.
8:48
For example, running the simulation a million times shows which price levels are rare.
8:54
This symmetry won’t tell you exactly how to trade, but it does offer insights into the overall shape of the market.
9:01
Let’s do this for two hypothetical markets: In the first market, traders place orders
9:07
based on the price distribution and a uniform volume distribution. So, the volumes could range anywhere from 0 to the maximum trade volume,
9:15
each with an equal probability. Most importantly, they have unlimited wealth to back all their trades.
9:23
This means they can always afford whatever volume they want to order at any price, buying and selling completely randomly.
9:31
As a result, the orders the traders can offer are independent of the absolute price level.
9:36
And this means that the typical daily price changes, derived from the order curves,
9:42
are also essentially independent of the absolute price level. Each day acts like an independent experiment,
9:48
detached from the past, and then stacked on top of the previous days. The prices in this market follow what’s known as a «Gaussian random walk,»
9:57
with an expected price change of zero. And even if the real market price suddenly spikes,
10:03
we’ve learned that each trading day operates independently from the previous ones. And so the forecast shape remains unchanged.
10:11
There’s no external force pulling the price back down again. You’re essentially running the same prediction again,
10:18
just at a new price level. In such a random walk, it’s likely for prices to eventually reach arbitrarily high or low values over time;
10:27
here on a logarithmic price scale. Now, contrast this with the second market,
10:33
where traders are limited by their wealth. Here, the forecast shape differs significantly.
10:39
Why? It comes down to the trading rules. In this market, traders can’t borrow money to buy shares,
10:46
so their buy volumes are limited by what they can afford. When prices get too high,
10:52
their ability to buy decreases sharply. They simply get fewer shares for the money they’re willing to spend.
10:58
Selling, however, is less restricted. They can place sell orders for any portion of their holdings at virtually any price,
11:06
regardless of whether anyone buys. These sell orders could be wishful thinking.
11:12
This introduces an asymmetry: as prices rise, the volume of buy orders shrinks due to the lack of money,
11:20
while sell orders remain here unaffected. If prices drift too far from the center,
11:25
this asymmetry creates a natural pull, nudging them back. We can see this more clearly when we examine the theoretical limit.
11:34
Here, we assume an infinite number of traders placing buy and sell orders. This blends individual actions seamlessly into the overall system,
11:42
which gives smoother curves and reveals the market dynamics better. Now, comparing this to the Gaussian random walk of the first market,
11:51
where the shape of the order curves remained independent of the absolute price level, we clearly see the additional price nudge in the second market.
11:59
Prices still fluctuate randomly, but now they orbit a sort of gravitational center.
12:05
Over time, these fluctuations settle into a band. In theory, prices could rise indefinitely.
12:12
But it becomes increasingly unlikely, given the order asymmetry. This is a fascinating observation!
12:18
The rules governing how our people can trade effectively create practical, soft limits on price movements.
12:26
At least when no one is talking about it. In reality, any publicly known price limit is quickly exploited and disappears.
12:34
But assuming for a moment this limit holds, then this it, what it means: When our traders keep adding new money to their trades,
12:42
they are injecting new funds into the market, and a statistically significant trend channel forms.
12:48
And think about this: At no point does the simulation instruct the market to form channels.
12:54
This pattern emerges naturally as a result of the market rules and the traders’ order behavior.
13:00
And this trend is different from the trends in a Gaussian random walk. Those trends were just coincidental and lacked real significance.
13:09
Even if we add a drift to a Gaussian random walk, it won’t produce this kind of band channel.
13:15
That’s worth investigating. But not today. Because there are some more useful price movement patterns I want to show you.
13:22
For example, increasing the number of traded shares, the volume, makes prices less volatile.
13:28
Why? Well, few orders make choppy order curves which generate on average bigger price jumps.
13:35
More orders make smoother curves and average out to smaller jumps. Here, I’ve rescaled the volume in the diagram
13:42
to better fit the order curves within the screen. So, with a lot of orders, say, a million, the price barely wobbles.
13:49
Sure, prices can still shift if expectations surge suddenly, but they don’t fluctuate wildly.
13:56
Here’s what this means in real life: When you see a massive price jump, it doesn’t necessarily signify major news.
14:03
It could be fewer people trading. Fewer trades make bigger jumps.
14:09
And if you want to put these jumps into context, you can draw a band showing what’s «normal» at various volume levels.
14:15
I share the code in my tutorials so you can see how these factors influence market movements.
14:21
So, these patterns highlight how trading behavior shapes randomness. And in the toughest market imaginable,
14:28
the Gaussian random walk, you cannot make predictions that can be exploited which ties back to our initial question.
14:35
How can you reliably win in a market where everyone else acts completely at random?
14:41
Imagine yourself in that situation. To win every single time, you’d need to know something about the future.
14:48
But there’s our problem: you can’t predict what everyone else will do. It’s all random.
14:54
So, if predicting others isn’t an option, what’s left? The only variable that can shape the future to your advantage…
15:03
is you … Winning isn’t about predicting the market anymore,
15:08
it’s about taking control. And control means more than just reacting faster,
15:14
it’s about dictating prices and shaping how others perceive market trends. And this hints at the level of influence required to make it happen.
15:23
It might seem like an obvious realization, but I wanted to point it out because it’s so important.
15:30
In the next section, we’ll explore the mechanics of this control and see how deliberate actions can distort a random market.
Self-Trading & Price-Setting
15:40
So, what would it take to nudge a market’s price in your favor? For instance, let’s say you bought some shares,
15:47
and now you want to artificially increase the market price. The first step is simple: I enter the market and say,
15:53
«I’m buying 600 shares at 55 dollars each!» Remember, the buyer curve shows how much people are willing to pay at various prices.
16:02
So, when we slot my order into this buyer curve, the market price takes a step up.
16:07
In other words, my order adds more demand at a higher price point, justifying a higher market price.
16:13
By adjusting my order, tweaking the price or the volume, I can influence the market price.
16:19
All it takes is placing enough volume at higher price levels. But there’s a catch: this ‘strategy’ comes with a cost.
16:27
I can’t just talk about buying these shares. I actually have to buy them to cause a price shift.
16:33
And that’s incredibly expensive. My action moved the price, but at full cost.
16:39
Still, I shouldn’t expect anyone’s sympathy. This tactic is usually considered illegal
16:45
since my intention was to mislead other traders. And if the goal is to exploit other traders anyway,
16:51
there are ways to achieve more impact for the cost, and we don’t even need to spread faulty news for that.
16:57
So, how can we manipulate the market price without footing the bill? At first glance, if we place a big buy order,
17:05
we’d end up paying the seller 600 shares times whatever the market price will be.
17:10
To break even, we need to get that money back somehow. The trick is to sell the same number of shares
17:17
right back, to ourselves. This practice is called self-trading. But here’s the interesting part:
17:24
we’re not just moving shares from one pocket to another in secret. Instead, we’re doing it publicly:
17:30
From the left pocket, through the exchange, into the right pocket, making it look like legitimate market activity.
17:37
By itself, self-trading doesn’t magically change the market price. It simply shifts supply and demand.
17:44
The point is perception. Faking higher volume creates the illusion of a liquid market.
17:50
Which is great because, in real markets, traders often see high volume as a signal that
17:55
something big is happening, like breaking news. But remember our catch: in our simulation, this fake volume doesn’t influence anyone.
18:04
Our traders act randomly, ignoring these signals entirely. And that’s what makes this problem so challenging.
18:12
If perception alone won’t work, we need to directly influence the market price;
18:17
a strange concept when most traders take prices as given. These are price takers.
18:24
To manipulate the market, we have to think like price setters. And here’s how it works:
18:31
Imagine a small stock where daily volume is usually low. Placing a buy order of 600 shares at $55
18:39
and a sell order of 600 shares at $55 creates the illusion of high activity.
18:45
As we increase the volume, we pay more but still lack full control.
18:51
But when the buy and sell orders overlap, we reach a tipping point. Every trade within that range is effectively
18:58
self-ordering at a zero price difference. This enforces the intersection of the curves
19:04
which gives us control of the market price. And once we have control, we can set any price and volume we want,
19:11
pushing it high enough to overcompensate for any initial costs. We’ve successfully hijacked the market’s pricing mechanism.
19:20
This is called monopoly power in a stock market, where ‘buying the whole market’ lets you dictate prices.
19:26
It’s similar to how a company with a product monopoly can manipulate supply to raise costs.
19:32
In real markets, this tactic doesn’t just distort the price. It can also trick traders into believing it’s genuine activity.
19:40
It’s particularly easy in smaller, less regulated markets, where the initial cost is lower.
19:46
So, as you can see: With trade-based manipulation, one can distort signals like price and volume
19:53
and trick traders into making poor decisions. So, our friend should watch for one unusually large buy and sell order at nearly the same price.
20:02
That could be an attempt at manipulation. Alright, so our friend here is running low on funds,
20:09
just like the rest of the ‘good’ traders. It’s time to step in and help them out by cracking their opponent’s moves.
20:16
We’re going to walk through one complete manipulation cycle, to really understand it.
20:22
And then we’ll figure out how to blend these moves seamlessly into the noise of the crowd.
Manipulation Cycle
20:29
Let’s take a closer look at how the whole scheme works, here in a market that follows a Gaussian random walk.
20:35
And to better see what’s happening, we track the manipulator’s money, shares, and the relative wealth
20:41
compared to the rest of the market. That’s the total money you hold, plus the market value of your shares,
20:47
compared to what the other traders have. So, first, the scheme starts with buying as many shares as possible
20:54
without drawing too much attention. The goal is to stay under the radar while gradually building up your position.
21:01
So, in the graphs, we see money slowly being converted into shares. Then comes the price manipulation.
21:09
This involves using self-trading, where you partly buy and sell shares to yourself, to gain control and nudge the price upward.
21:17
Here, I took a rather obvious approach to demonstrate the mechanics. But you can make it less noticeable,
21:23
nudging the price up by a small percentage. It won’t work every day. Some days, you might not have full control, or the market could move unpredictably.
21:32
Well, that’s part of the gamble. As a manipulator, I wouldn’t say you are in a position to complain.
21:37
During this phase, you’re also buying more shares to maintain control. Finally, once the price has been inflated enough, it’s time to sell.
21:46
The goal here is to offload your shares quietly, cashing in on the inflated price without causing too much disruption.
21:54
By the end of the cycle, you’ve gone from having no shares and a million dollars, to holding no shares again, but now with a larger amount of
22:02
1.7 million dollars. You can see in the relative wealth graph that we’ve managed to take a significant slice from the other random traders.
22:12
This is a form of the classic «pump-and-dump» scheme. What makes the method here stand out is that it’s entirely trade-based.
22:20
We don’t issue fake news. We just control the price with self-trading.
22:25
To show it works on average, let’s imagine the same situation without manipulation.
22:31
You buy shares for the same amount of money over the same period but don’t artificially inflate the price.
22:37
Many simulations show that the non-manipulated version consistently underperforms compared to the manipulated one,
22:44
proving the scheme’s effectiveness. What’s particularly troubling is that even when people aren’t trading randomly,
22:51
like in the final phase when they start selling alongside you, it’s still possible to predict their behavior and factor it into your plan.
22:59
In fact, if the scheme works in a completely random market, it works even better when traders follow predictable patterns.
23:07
Now, where does the manipulator’s profit actually come from? There’s one driving factor that makes this whole scheme possible:
23:15
the assumption that tomorrow’s price is likely to be close to today’s price.
23:21
If traders didn’t rely so much on recent price trends, meaning they wouldn’t simply accept the inflated price level,
23:27
this kind of manipulation wouldn’t be possible. You might think that basing trades more on fundamental factors,
23:35
like a company’s performance, sounds like the rational approach, and you’d be right. But it only works if everyone does it.
23:42
Markets are inherently driven by participants outbidding one another, fully aware that they are trading at irrational prices.
23:50
This, in itself, is also a fundamental factor: the human factor.
23:55
That said, our self-trades here are still easy to spot. And exchanges could simply ignore these orders,
24:02
or regulators might investigate them. So, let’s figure out how manipulators manage to blend into the crowd.
24:08
Because, you can’t investigate, what you don’t know about. By now, you’ve probably spotted the trick:
24:15
it’s not a crowd of people moving the market. It’s one person pulling the strings behind the scenes.
24:21
The idea is to scatter coordinated self-trading orders across the market,
Hidden in Plain Sight
24:26
making them look like harmless activity, except they’re not. These trades still carry enough weight
24:33
to nudge the price where the manipulator wants it. If we spread these orders out more smoothly,
24:39
the manipulation becomes much harder to detect. There are still some unusual dents in the order curves,
24:45
but now they’re more subtle and could go undetected. Now, how could manipulation be concealed even better?
24:52
First, we need to learn how to quantify it. There are several ways to go about it: The idea is to identify irregularities in the order curve shape.
25:02
To achieve this, we can exemplarily standardize the curves to fit a 0–100% volume range
25:08
and the expected un-manipulated price range. Then we run multiple simulations without manipulation
25:15
to establish a reference for normal market behavior. This creates a band of order curves, helping quantify
25:22
what counts as «unusual» behavior. And as we have seen for price setting,
25:27
manipulation has a tell. You’d expect unusual behavior in both order curves.
25:33
There are several ways to assign numbers to this unusual behavior to estimate how much manipulation is happening.
25:40
If you’re interested, my coding tutorials dive into building the simulation and running these tests.
25:46
Also, on a related note, we are looking into an intriguing connection between wealth distribution in markets and the statistical mechanics of an ideal gas.
25:56
Both systems have conserved quantities like total money, shares, or energy. And as traders or particles continuously interact,
26:04
they naturally settle into equilibrium distributions. In that sense, you can loosely think of a market as having a ‘money temperature,’
26:13
which offers an interesting perspective on markets. But for now, let’s go back and see how
26:18
the amount of manipulation varies across different scenarios. Here are three distinct price jumps,
26:25
but not all of them are caused by manipulation. For example, this jump right here?
26:30
That’s a genuine market reaction to positive news about the company. We can simulate this with our traders reacting to what is called a sentiment curve.
26:39
Think of the sentiment curve as a signal reflecting the market’s collective belief about a company’s future.
26:46
Positive news can shift the curve upward, representing increased confidence of investors.
26:51
With fresh money injected into the market, both the trading volume and price drive upward.
26:58
Compare that to a random price jump caused by low trading volume. Here, the sentiment curve stays flat.
27:05
Nothing external has changed. However, if we had inflated the volume with
27:10
self-trading without actually price setting, it would have looked more like news than noise.
27:15
At least on the surface. A price jump accompanied by increased volume seems natural for good news.
27:22
But self-trading leaves a trace, making it detectable in the manipulation graph.
27:27
One important note: this graph isn’t proof of manipulation. Patterns like these occur naturally.
27:34
Eventually, it’s about identifying traders with repeated suspicious behavior. And only when more instances stack up
27:40
does it trigger further investigation. Now, what happens when we go for price-setting?
27:47
That’s the pump-and-dump method. The sentiment stays flat. There’s no real news driving the price.
27:53
So, all the activity is fake. And here’s the thing about fraud detection:
27:59
it’s a constant cat-and-mouse game. Let me show you an example. Instead of pushing the price with a simple, obvious distribution that leaves dents on the graph,
28:09
we can disguise the manipulation further. By crafting a carefully-shaped manipulator price distribution,
28:16
we make the final order curve look completely normal. It’s just… shifted.
28:21
What does that mean? It means we’ve essentially faked an entire market at a different price and volume level.
28:28
That’s about as deceptive as it gets. The complicated part? It comes with a huge initial cost
28:34
and you have to guess what the original price distribution will look like. If you guess right, this kind of manipulation can be undetectable,
28:43
at least from the order curve shapes alone. Things get even trickier when manipulation pairs up with real information.
28:51
Not fake news, but reliable information. Take positive sentiment, for instance.
28:56
It’s natural to expect the market to go up when good news breaks. But how much of an increase is reasonable?
29:03
Only one of these markets here is free of manipulation. The others amplify or downplay the news.
29:10
So, how can you tell, right off the bat, which one is genuine? Each one aligns with the truth to some degree.
29:18
The main takeaway is this: when ‘someone’ gains monopoly power over the market,
29:23
the market can’t function as it’s supposed to. It becomes a losing game for everyone else.
29:29
And if that ‘someone’ isn’t you, then no matter how sharp your predictions are, you’re likely to fall prey to the manipulator.
29:37
You might be thinking, «Well, these frauds don’t really happen no longer in the big, regulated markets
29:42
where my retirement funds are parked.» And you’d be mostly right! Nowadays these markets are monitored by oversight teams equipped with
29:51
far more advanced financial forensic tools to keep the game fair for the rest of us.
29:56
In a way, this video is a nod to their work. But as more people dive into less-regulated markets,
30:02
maybe there’s wisdom in not taking every price. When a deal looks too good to be true,
30:08
well, you know how that usually goes. But every once in a while you do get lucky
30:14
and find a deal that works in your favor. Take this one: If someone offered to teach you
30:19
math, data analysis, programming, and AI, that’s the volume, in just a few minutes of hands-on learning a day,
30:26
that’s the price, that’d be a solid trade! Well, that’s Brilliant.
30:31
And what I like about Brilliant is that they don’t just throw information at you. They help you figure things out for yourself.
30:39
Every one of the thousands of lessons is interactive, letting you solve problems while playing with concepts.
30:45
It’s an intuitive approach, and for me, that’s what makes learning stick. If today’s video got you curious about market trends and data patterns,
30:54
have a look at the new data science courses. With real-world datasets from Airbnb, Spotify, and more,
31:01
you’ll learn how to spot trends and make smarter decisions. To try everything Brilliant has to offer for free for a full 30 days, visit
31:09
brilliant.org/braintruffle/ or scan the QR code onscreen, or you can click the link in the description.
31:16
You’ll also get 20% off an annual premium subscription. Thanks for watching, and thank you for your support!